It’s no secret that it takes a considerable amount of time to develop as a time trial specialist - a discipline of cycling that relies on specific physiological qualities, highly technical equipment and adaptation to what could only be described as a unique position for the human body.
Working with Jordy Villani (Giant Australia x Giant Ormond) over the last 18 months has provided insight into the development of his time trial performance, from amateur to class leading athlete.
So how does his progress look?
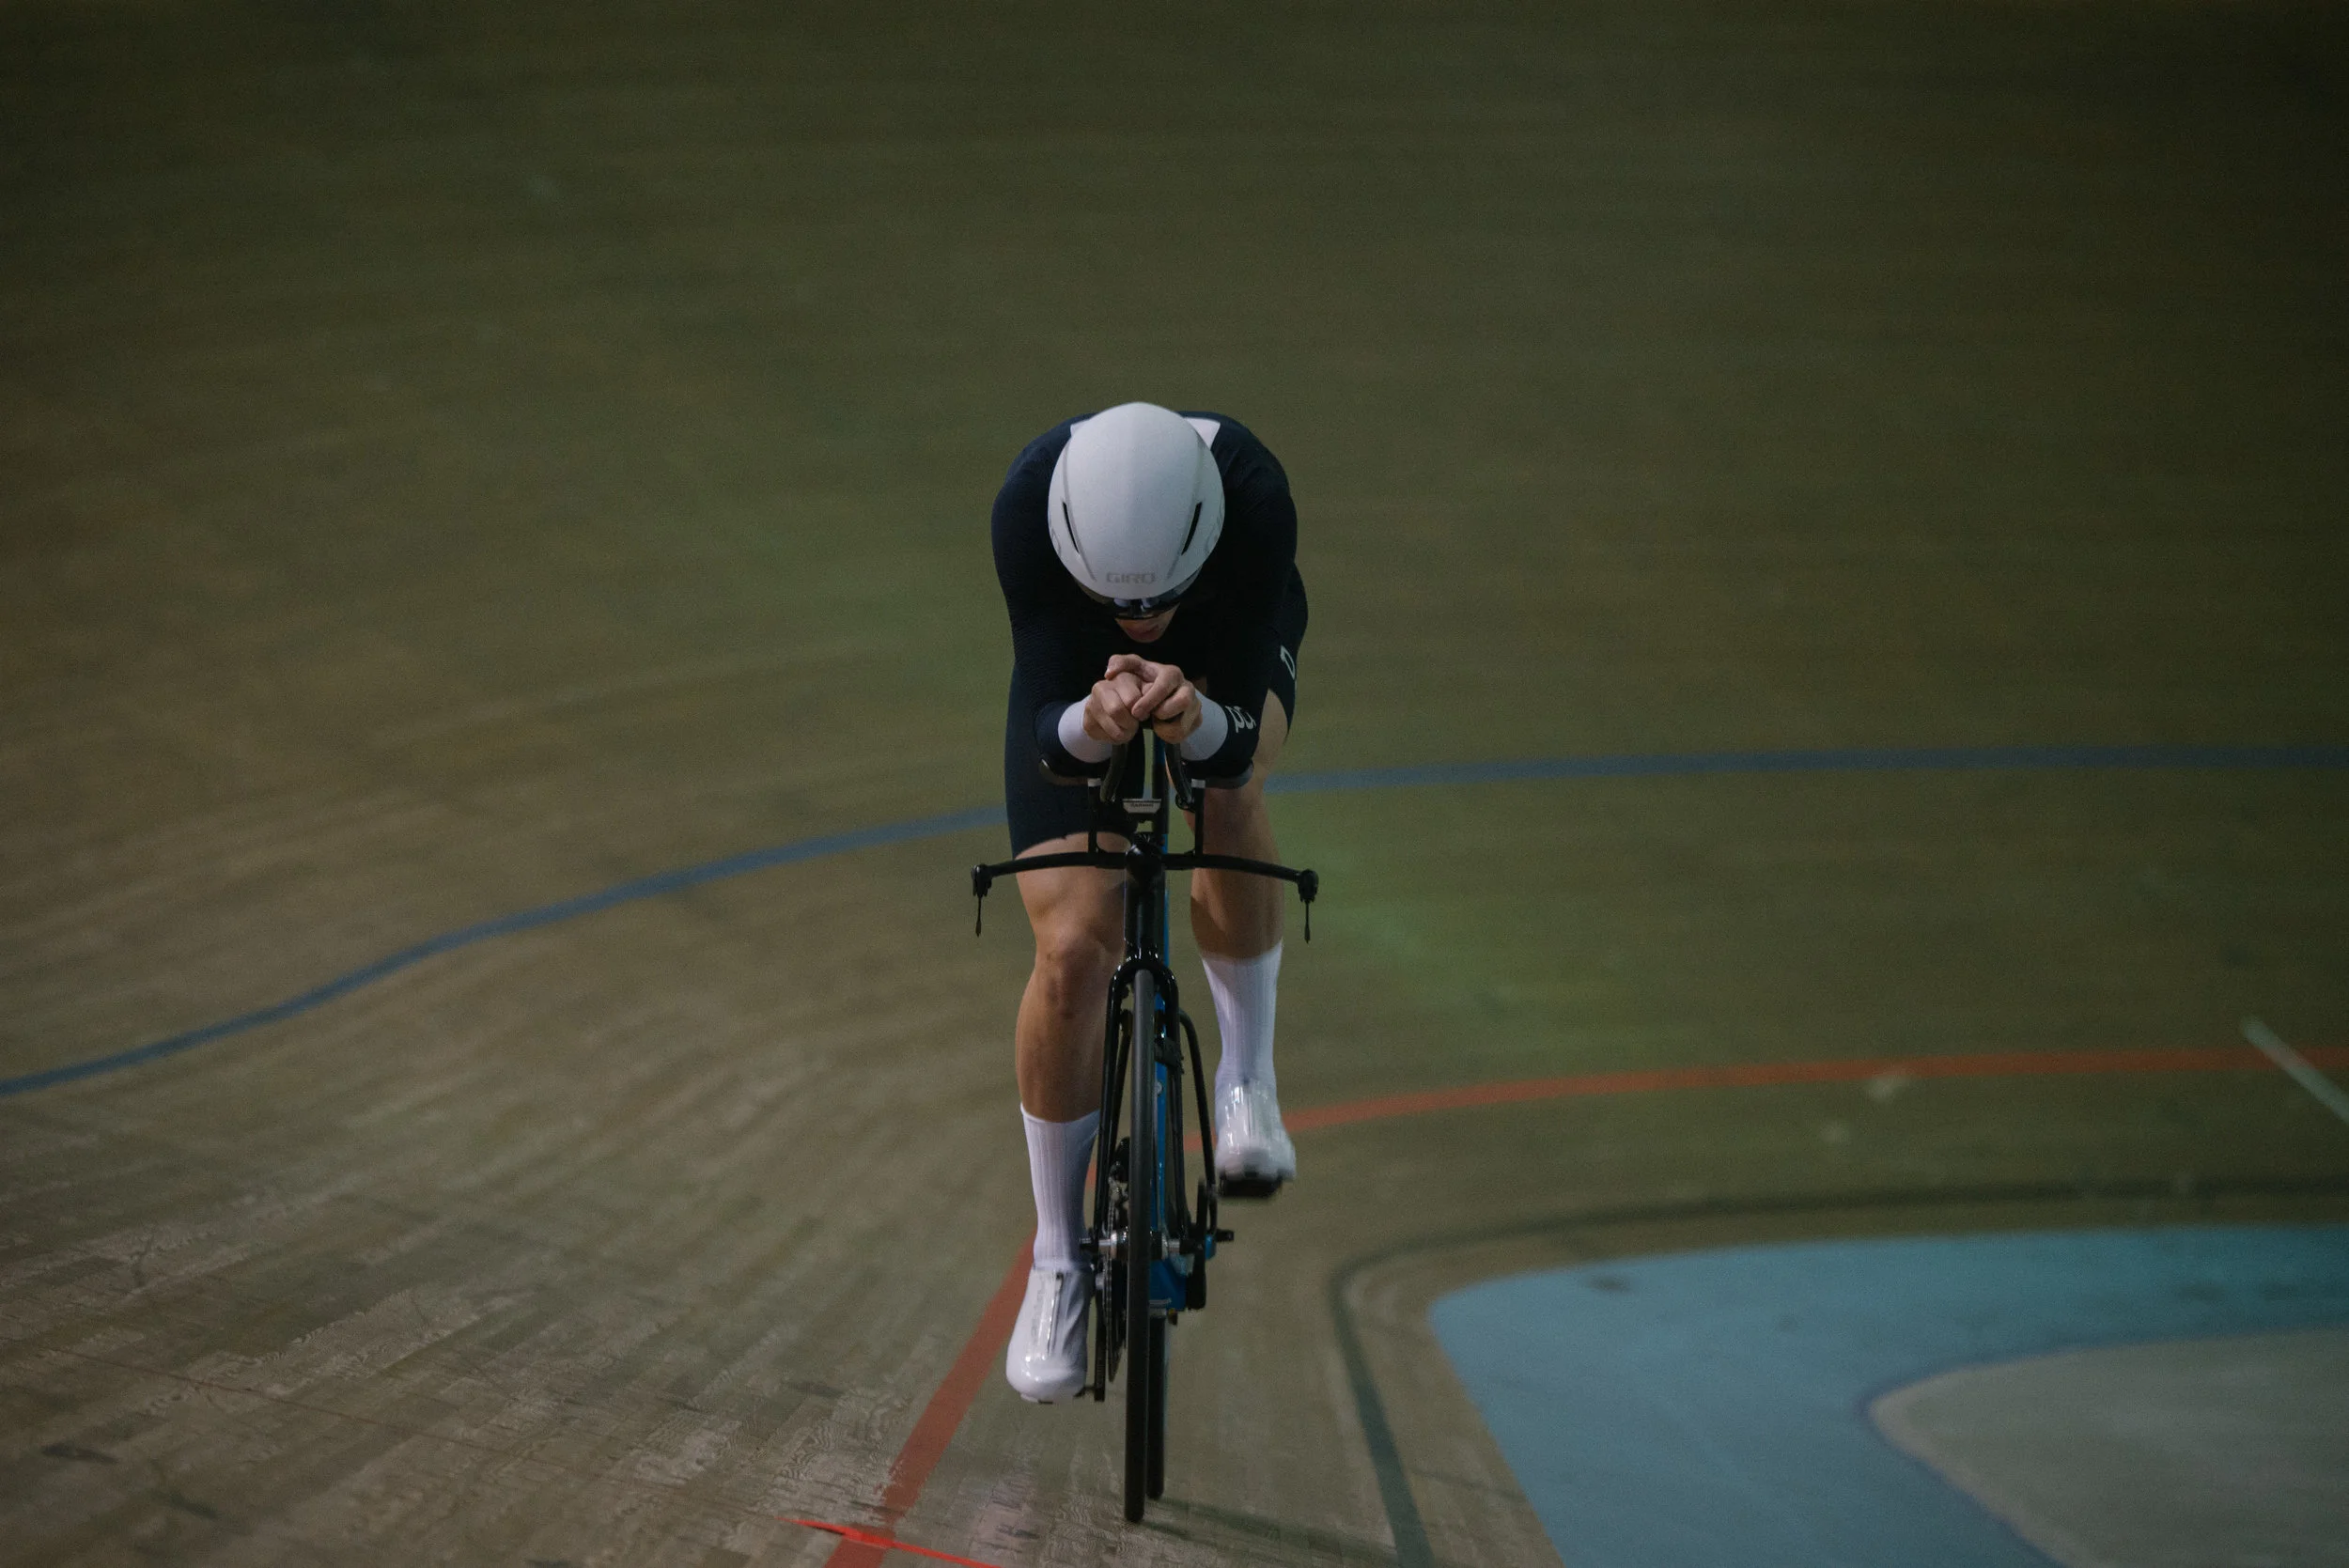
Jordy Villani during aero testing using Alphamantis Technologies Track Aero System. Image by: @blakenorrish
Equipment
Since we started working with Jordy on this project, his bike has been fitted with a power2max Type-S power meter, the accuracy of which has been confirmed with the CYCLUS2 ergometer. The one power meter has been used for all data reported and the accuracy of this device has been confirmed over this time period.
Control wheels have been used in all testing sessions, limiting the variables contributing to a change in system coefficient of drag. The same testing protocol has been used for aero testing and data has been analysed and post-processed in a custom built data analysis package, specific to the application of track aero testing data.
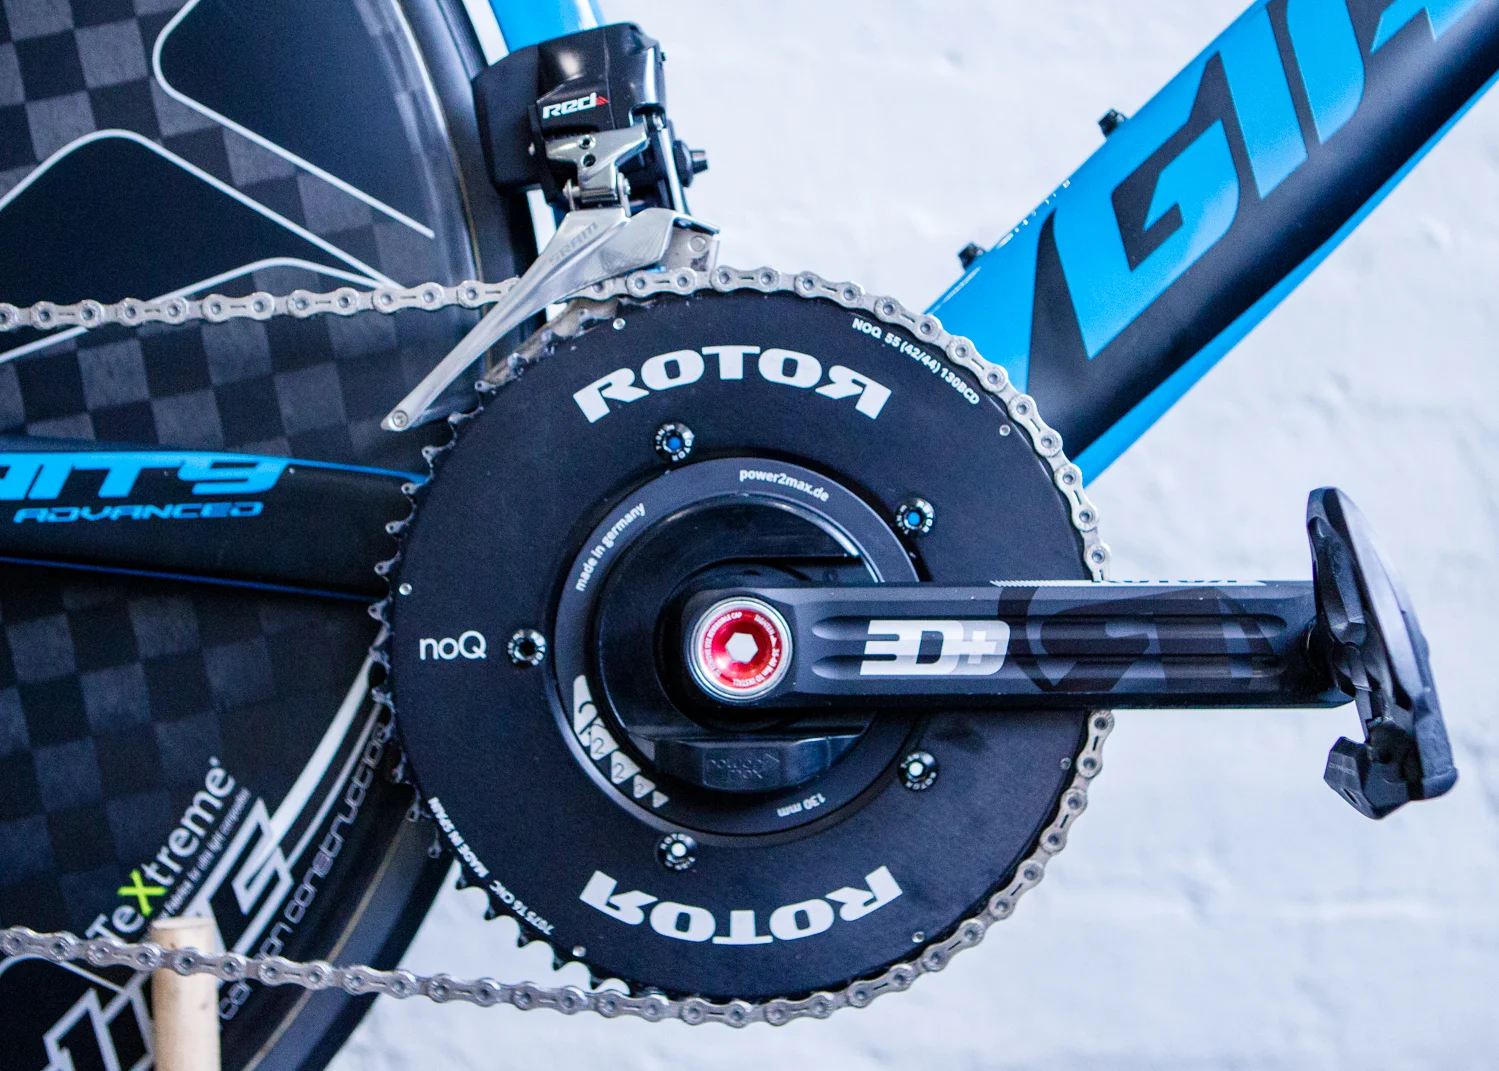
The ever-dependable power2max, the same device has been used across all testing sessions, accuracy confirmed againast the CYCLUS2 ergometer. Image by: @aaronupson
What is important to time trial performance?
Time trial performance predominantly relies on two key factors. Firstly, high power output, over the duration required and secondly, a low coefficient of drag (CdA), derived from both positional qualities and equipment choice.
While power-to-weight (Watts/kg) is important in some race scenarios (hilly time trial course), it is power-to-drag (Watts/CdA) that comes up trumps in most time trial competitions. This means that two key attributes take priority in the development of a time trial athlete - Power output (over a duration of 20-60 minutes) and aerodynamic efficiency.
“An improvement in aerodynamic efficiency should never come at a cost to the athlete achieving realistic power/duration targets. These goals are set using physiological testing processes, in the lab and in the field.”
Baseline Assessment
The whole process of refining Jordy’s position started in the lead up to the 2016 Tour of Bright. After a bunch of solid performances, and the decision to focus on time trial competition, the process of position optimisation commenced. As always, we started with lab-based position optimisation, working on saddle choice, defining saddle position and establishing the basic front-end positional characteristics that formed the foundation of a position suited to punching out big Watts. In the month leading up to Tour of Bright, a number of testing methods were used to start looking at Jordy’s performance.
Jordy’s Maximal Aerobic Power (MAP) at the time was 416 Watts and in field testing he was able to punch out 20 minute efforts (in position) at 369 Watts (89% of MAP). These sessions proved that Jordy was successfully performing intervals at the percentage of MAP that we expect for an endurance trained athlete. Performances in early 2017 backed these numbers up, seeing Jordy consistently hit 360-370 Watts for 20 minutes in competition. With 369 Watts recorded over a 20 minute period, this power output has been used to calculate his power-to-drag ratio.

Jordy's Maximum Aerobic Power (MAP) test data from October 2016. With the completion of this test, he recorded a new MAP of 416 Watts.

Jordy's best 20 minute power, recorded in November 2016, performed on his TT bike. Jordy average power output was 369 Watts for 20 minutes, equivalent to 89% of his MAP.
With endless variables to consider, the only way to really refine a time trial position is through aero testing. We use the Track Aero System, developed by Alphamantis Technologies, allowing us to evaluate aerodynamic performance in the field. The Alphamantis system takes ride data from the bike and uses environmental conditions to calculate system CdA, as the athlete performs.
Establishing a baseline value for aerodynamic efficiency is the starting point with aero testing. For Jordy, we were able to determine that his baseline CdA was 0.259 m^2 and this would see him sitting at 1425 Watts per CdA.
The goal of initial testing was to establish the importance of pad stack and elbow pad stance, allowing us to better understand the priorities in further optimising his position. For Jordy, at this particular point in his development, a change to pad stack provided the greatest improvement, allowing us to get his CdA down to 0.254 m^2, or 1453 Watts per CdA. At 375 Watts, this improvement in aerodynamic efficiency is worth 20 seconds over a 40 km race distance and is the equivalent to a 7 Watt increase in power output.


Power and time savings associated with a drop in pad stack. Calculations have been based on a 375 Watt work rate.
The New Bike
A change from the previous generation Giant Trinity Advanced to the current model, provided the perfect opportunity to re-test Jordy’s position. From our aero testing we knew the priority was a drop in elbow pad stack, so the goal was to make this sustainable. Time on the bike focusing on position consistency and equipment changes both contributed to a more effective position.
To help facilitate the lower position, elbow pad wedges were installed, tilting the elbow pads and providing greater stability with a high-hands position. The Aerofuel II saddle offered greater width and a larger central channel than the original Prologo (T-Gale PAS), providing more effective pressure relief when lowering the front end. For Jordy, like most time trial athletes, it is this anterior soft tissue pressure that was obstructing anterior pelvic tilt, a necessity for reducing the torso angle. Not only is pelvic tilt a requirement of achieving an aero position, it is also a requirement in achieving position consistency and avoiding awkward saddle shifts.


Images by: @aaronupson
So how did the changes stack up?
The baseline for round two of aero testing saw Jordy record a CdA value of 0.244 m^2. These runs were performed using a standard road shoe (Sidi Wire) and cotton sock (Swiftwick) combination. Over Jordy’s best runs from his initial aero session, this is an equivalent power gain of 15 Watts, a time saving of 41 seconds over a 40 km race distance.
One of the goals of this testing session was determining the improvement in aerodynamic efficiency, attributed to the aero shoe and aero sock combination. The change to the Suplest Aero and the Rule 28 AeroSox saw Jordy’s CdA drop to 0.238 m^2. Over the regular shoe and sock combination, these provide an equivalent power gain of 9 Watts at 375 Watts, a time saving of 25 seconds over a 40 km race distance. Based on his previous 20 minute power, this now sees Jordy hitting 1550 Watts per CdA.


Power and time savings associated with position refinement and a change of equipment. Calculations have been based on a 375 Watt work rate.
Note; We have not been selective in isolating the changes of equipment, these CdA calculations represent refinement in aero position and improvements in equipment.
Improving Power Output
Working towards Tour of Bright 2017, we were focusing on building Jordy’s Maximum Aerobic Power (MAP) before targeting specific time trial work. In late July 2017, Jordy recorded a new MAP of 437 Watts and, early in the build phase to Bright, he was consistently performing 20 minute efforts at 370 Watts (in position). To put this in comparison to the previous year, he was already exceeding his best in the prior season, before focusing on the specific time trial work.

Jordy's Maximum Aerobic Power (MAP) test data from July 2017. With the completion of this test, he recorded a new MAP of 437 Watts.

Balliang individual time trial, June 2017. Jordy recorded 355 Watts for a duration of 25:50.

Leongatha individual time trial, July 2017. Jordy recorded 350 Watts for a duration of 26:06.

Wangaratta individual time trial, August 2017. Jordy recorded 371 Watts for a duration of 23:30.
Building to tour of Bright 2017
Improving power output and reducing CdA are always the priorities for improving time trial performance and in the final build phase for Bright, both were on the agenda. While specific intervals were prescribed, the focus was equally on the quality of the position held during each effort.
Shrug and Tuck
Want to get very good at time trialling? This is what you are going to have to learn to do. Imagine looking at yourself in the mirror head on and viewing the silhouette of your body on the bike (frontal profile). The head and the shoulders are the key structures contributing to the body’s “footprint” and techniques employed to hide these, have a dramatic effect on improving aerodynamic efficiency. This, in combination with a narrower elbow position, were the key changes for Jordy in the lead up to November testing.
With identical equipment and simply a focus on position quality only, the improvements since June were substantial. At the November baseline, a CdA value of 0.225 m^2 was recorded. Power wise, this improvement is equivalent to a 19 Watt power gain and time wise, equivalent to 58 seconds saved over a 40 km race distance (375 Watts).
Skin Suit
The lead into Bright was also about evaluating skin suit options and this is is a perfect example of the requirement to actually measure aerodynamic performance. Given the human body contributes about 70% of the total drag force resisting forward motion, it’s no surprise that the fabrics covering it have a huge impact on performance. With skinsuit “option 2” a CdA value of 0.216 m^2 was recorded. The change of garment provided an equivalent power gain of 14 Watts, equivalent to 40 seconds saved over a 40 km race distance (375 Watts). Based on Jordy's prior performance of 371 Watts over a 23 minute duration, this sees his power-to-drag ratio at 1718 Watts per CdA.


Power and time savings associated with position refinement and a change of skinsuit. Calculations have been based on a 375 Watt work rate.
Real World Performance
For real-world performance measures, we have reverted back to field testing. December testing showed that Jordy is now successfully able to perform 20 minute efforts at 390 Watts. Based on his most recent MAP test (July 2017), this equates to 89% of his MAP. This matches his previous best performance and showing that his improvement in position has not come at a cost to his power output. In terms of the real performance indicator, his power-drag ratio improved to 1806 Watts per CdA.

Jordy's best 20 minute power, as recorded in December 2017, performed on his TT bike. Jordy average 390 Watts for 20 minutes, 89% of his MAP.
What is Next?
Time trial is a discipline of constant refinement in the quest for speed. The last 18 months have focused on position optimisation and getting Jordy’s bike to a competitive point. In the lead up to Nationals, equipment optimisation is focusing on improvements gained thorough driveline optimisation and garment choice. Stay tuned for the final instalment in the quest for improving aerodynamic efficiency.
Special Thanks
A big shout out to Jordy for allowing us to share his CdA and power data. Thanks to Giant Bikes Australia and Giant Ormond, Jordy’s personal sponsors that allow him to use the best equipment available.
The data analysis processes would not have been possible without the help of Scott Gigante, creator of the custom data analysis package we use.
More can be found on the importance of aerodynamic efficiency on the Cycling Power Lab web page, including power-drag data for elite time trial athletes.